(Bloomberg) — In recent days, the wild swings in US stocks, largely driven by President Donald Trump’s repeated U-turns on tariffs, have caused many on Wall Street to throw up their hands in exasperation.
For technical analysts like Jefferies’ Daniel Kirsche, the chop has made scouring the charts for key levels all the more important.
In his view, the number to watch right now is 5,500 — the level the S&P 500 Index will need to reach to wipe out half the 19% drop from its February all-time high. Since closing below 5,000 two weeks ago and nearly falling into a bear market, the S&P 500 has, in fits and starts, clawed its way back to 5,376.
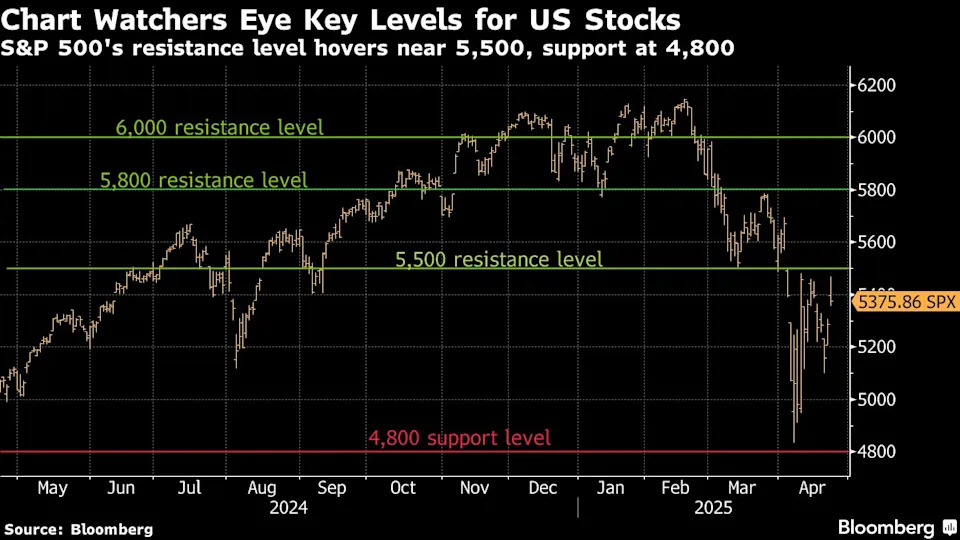
Trading above 5,500 — which would represent little more than a 2% advance from Wednesday’s close — would not only wipe out nearly all of April’s losses, but also signal to Kirsche that traders are switching from selling the rallies to buying the dips.
“The more often the market tests resistance levels, the more chances there are to go through them,” the head of technical analysis at Jefferies said. Once above that level, a rebound toward 5,800 to 6,000 “looks very achievable.”
For traders looking for where another bout of selling may leave the stocks gauge, 4,800 is the level to watch, more than 3.5% below April’s year-to-date low.
JPMorgan Chase & Co. ( JPM ) strategist Jason Hunter sees the market as vulnerable to a selloff in that range, or even reaching as low as 4,500. “We suspect that retest could set a more durable bottom.”
According to John Kolovos, chief technical strategist at Macro Risk Advisors, 4,800 could be the floor. “But given the recent downtrend, a move to 4,700 looks more probable, and there’s scope for a deeper test into 4,480 or even 4,300.”
Mixed Signals
Traders are also watching for market breadth as a growing number of stocks participating in a rally would be an indication of a more durable trend. Currently, 31% of stocks in the S&P 500 Index are trading above their 200-day moving average, up from less than 20% in early April.
“Bulls would like that number closer to 50%,” said JC O’Hara, chief technical strategist at Roth Capital Partners.
Another indicator that market watchers rely on is the relative strength index, or RSI. That measure fell below 30 in early April, an indication the selling was getting excessive, but in the subsequent rebound it hasn’t yet reached overbought levels, which tend to suggest buyers’ enthusiasm is at a peak.
“That signals the index has quite a lot of room to go,” said Jefferies’ Kirsche.