In trading, nothing matters more than knowing the direction of the market before it becomes obvious to everyone else.
Like a chess master who sees three moves ahead, the best traders anticipate, they don’t react. That’s why understanding trends and price action isn’t just helpful, it’s the edge that separates consistent winners from the herd of hopeful amateurs. Markets reward foresight, not hindsight. And if you’re serious about sharpening your trading instincts, there’s one tool that acts like a lighthouse in stormy seas: pivot points.
Think of pivot points as the market’s most basic trend analysis. They’re not based on guesswork or gut feelings, but on simple solid math — specifically, the average of previous trading sessions high, low, and close. This single number, and the support and resistance levels it generates, gives traders a reliable framework and boundaries for making decisions. Whether you trade stocks, ETFs, futures, or forex, pivot points help you see where the tides may turn and where the currents are strongest.
Now here’s where the real magic happens. Most traders stare at a single timeframe like gospel — daily charts, 15-minute candles, whatever their flavor. But the pros? They zoom out and see the big picture.
Daily pivot points tell you today’s bias .
Weekly points show you where the swing trades are heading.
Monthly and quarterly levels? That’s where the institutions play.
When you stack these timeframes together, you’re trading with a panoramic view of the battlefield. And that’s how you begin to master the market’s hidden rhythms.
In the language of seasoned traders, pivot points are less of a strategy and more of a market compass — quietly guiding decisions with mathematical precision. Born from the prior session’s high, low, and close, these levels offer a forward-looking map of potential support and resistance. Pivot points aim to identify where price may pause, reverse, or accelerate. It’s a classic tool in the toolkit — unassuming in its simplicity, yet powerful in its predictive potential.
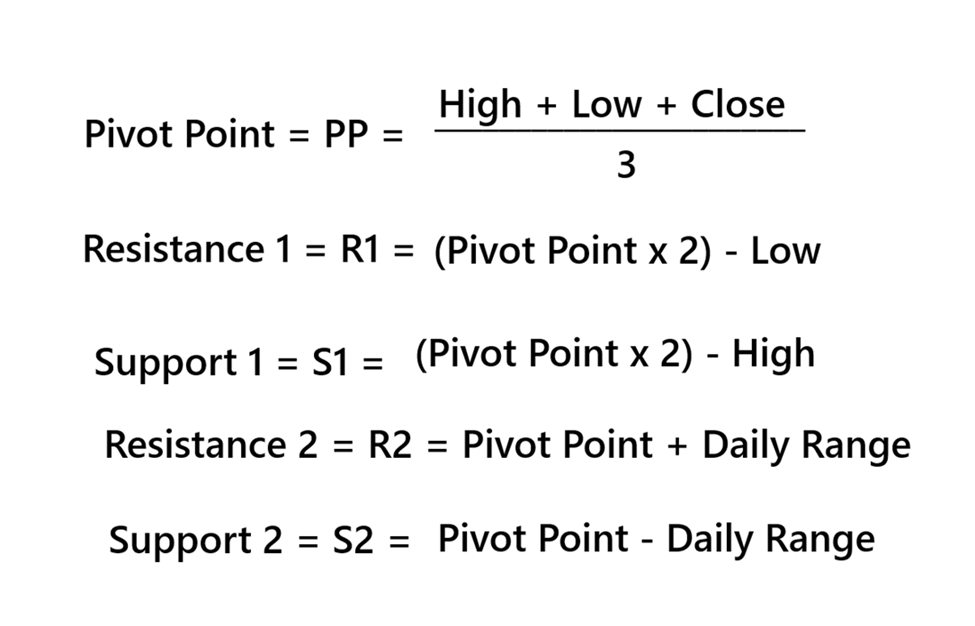
A pivot point is a simple, yet powerful, formula used by traders to forecast key price levels where momentum could shift. At its core, the pivot point is calculated as the average of the previous session’s high , low , and closing price — but its impact stretches far beyond just one number.
This single calculation becomes the nucleus around which a set of support and resistance levels are built, forming a framework of boundaries that traders use to gauge market sentiment. What makes pivot points uniquely valuable is how they adapt across timeframes: the same formula applies to daily, weekly, monthly, and even quarterly charts. Each timeframe acts as a lens, offering a different angle on trend strength, exhaustion, and reversals.
A daily pivot might help an intraday trader define risk and reward levels for the next few hours. A weekly or monthly pivot , on the other hand, provides a wider view — giving swing traders and institutional players an edge in identifying dominant trends and potential turning points. Together, these multi-timeframe levels act like guardrails in a volatile market, helping traders stay on the right side of the trend, avoid traps, and spot asymmetric opportunities with clarity.
One of the simplest — and most profoundly effective — ways to harness the power of pivot points is to lay them directly on your charts across daily, weekly, monthly, and quarterly timeframes. With just this one action, the fog of market uncertainty begins to lift. Suddenly, you’re no longer guessing where the trend is or where it might shift. You’re seeing clear, time-tested boundaries that reveal when price is aligned with strength… and when it’s warning of reversal. It’s like flipping on a spotlight in a dark room — what was once hidden becomes unmistakably obvious.
In this article, we’re going to apply this most basic form of pivot analysis to the S&P 500 . By layering daily, weekly, monthly, and quarterly pivot levels onto these charts, you’ll begin to see the subtle nuances in trend behavior — when momentum builds, when it stalls, and exactly where it’s most likely to shift. This is where the real beauty of multi-timeframe pivot analysis comes to life… and why so many top traders quietly depend on it to stay one step ahead.
Let’s start with the Quarterly S&P 500 Index.
Over the previous quarter the high for the S&P 500 Index was 6205. The low was 5533 the close was 5389.
This means that the PIVOT point is 5797 The First Support is 5389 The First Resistance is 6061 The Second Support is 5125 The Second Resistance is 6469.
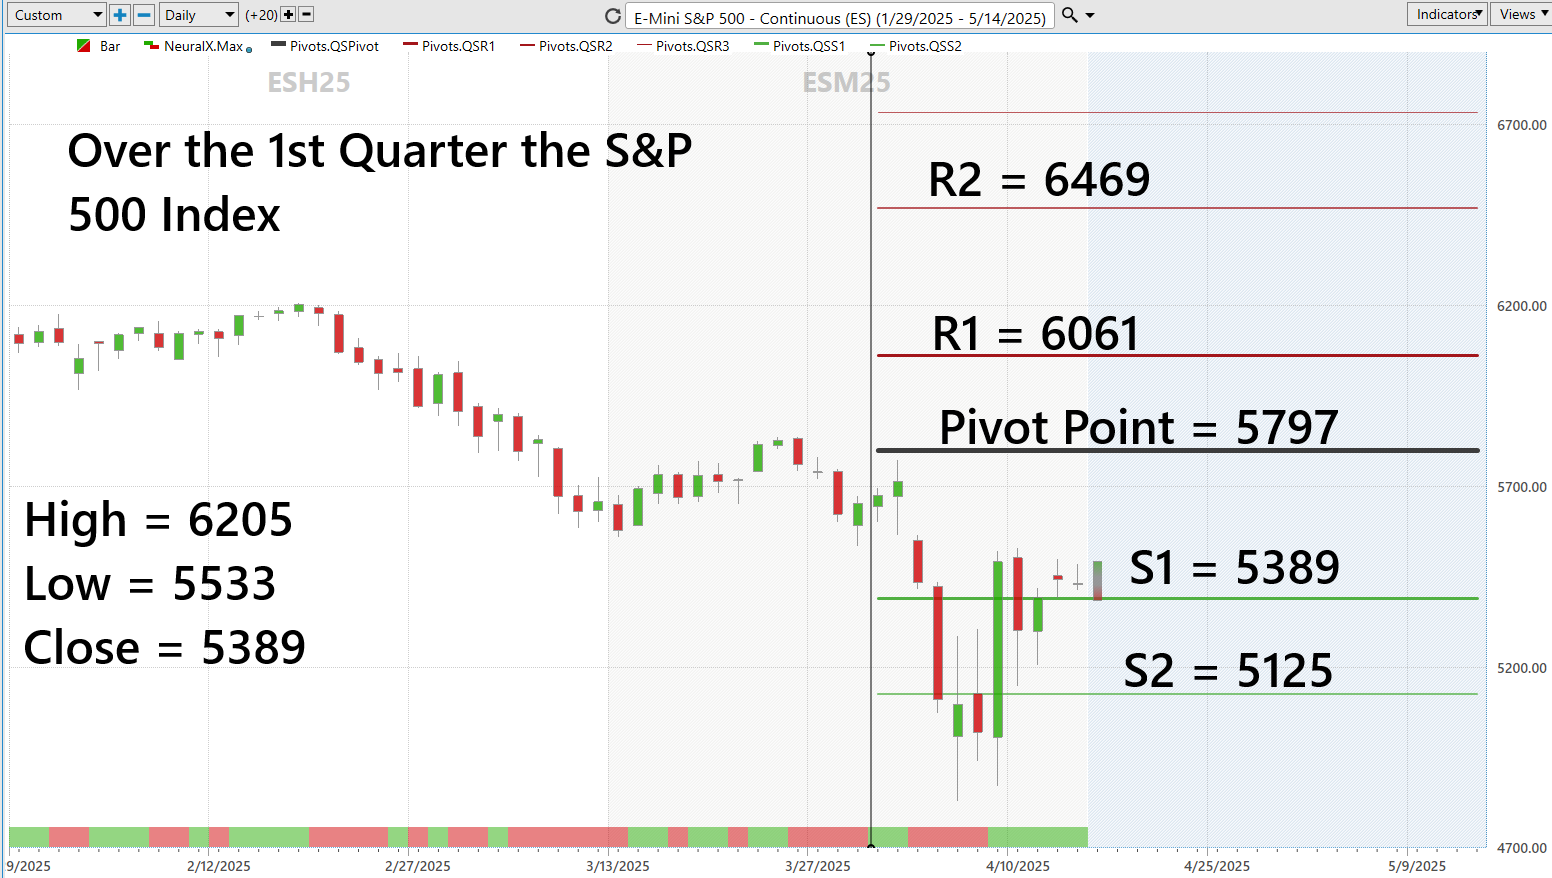
Now look at the chart. The S&P 500 is in a clear downtrend. The market tested the Pivot Point and failed. Failed at S1. Failed through S2 and eventually rallied back to S1. The market is clearly below the pivot point. The boundaries are very clearly drawn. The trend is very clearly delineated. My personal opinion is many top financial analysts and traders familiarize themselves with these levels before they go on CNBC, Fox Business, Bloomberg, or the like which allows them to appear knowledgeable in making quarterly forecasts.
When we drill deeper in the S&P 500 we can analyze the monthly Pivot Points. To make this calculation we use the highest price that occurred in March, the lowest price that occurred in March and the Closing price in March.
High = 6046
Low = 5533
Close = 5653

Now study the monthly S&P 500 Pivot Point chart. Regardless of how you flavor it we are firmly below the Monthly Pivot at 5744. The market is trying to hold S1 at 5442 but it has failed through S2 at 5231. The monthly Pivot Analysis tells us that the monthly trend is still down.
The cool feature of the Monthly Pivot Points in the VantagePoint A.I. software dashboard is that the horizontal lines extend into the following month telling you what the future pivot points will look like based upon what has occurred in the month so far.
Next, we can look at the weekly pivot char t and levels to see what they are saying. This is where things get interesting.
Over the previous week the high was 5528. The low was 4830. The close was 5391.
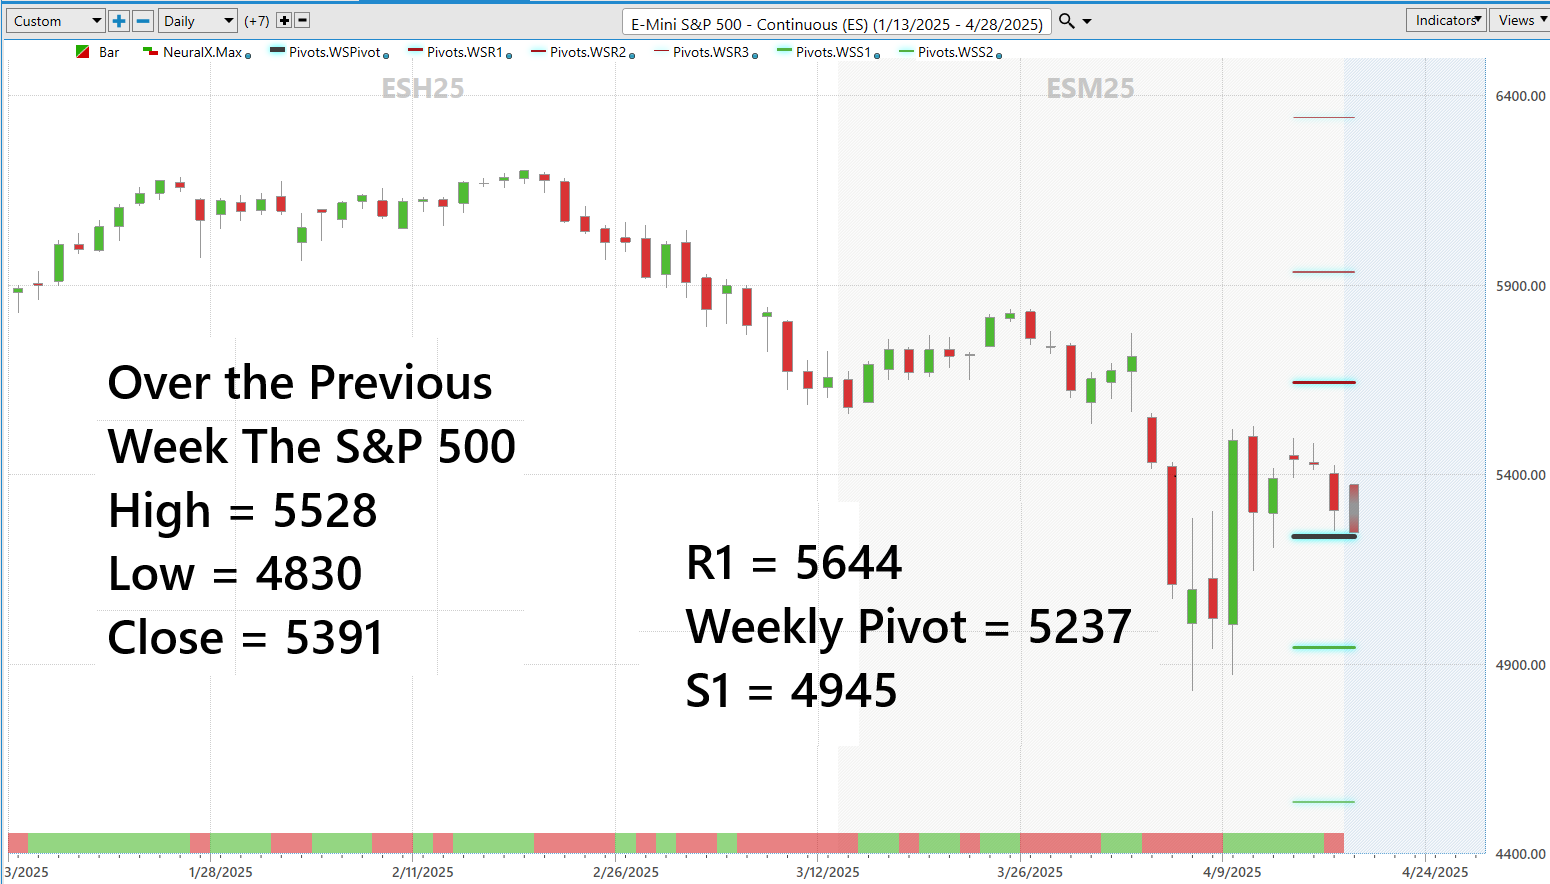
On the weekly pivot analysis, the pivot point is acting like support. Traders are paying very close attention to the 5237 level on the S&P 500 to see if it holds.
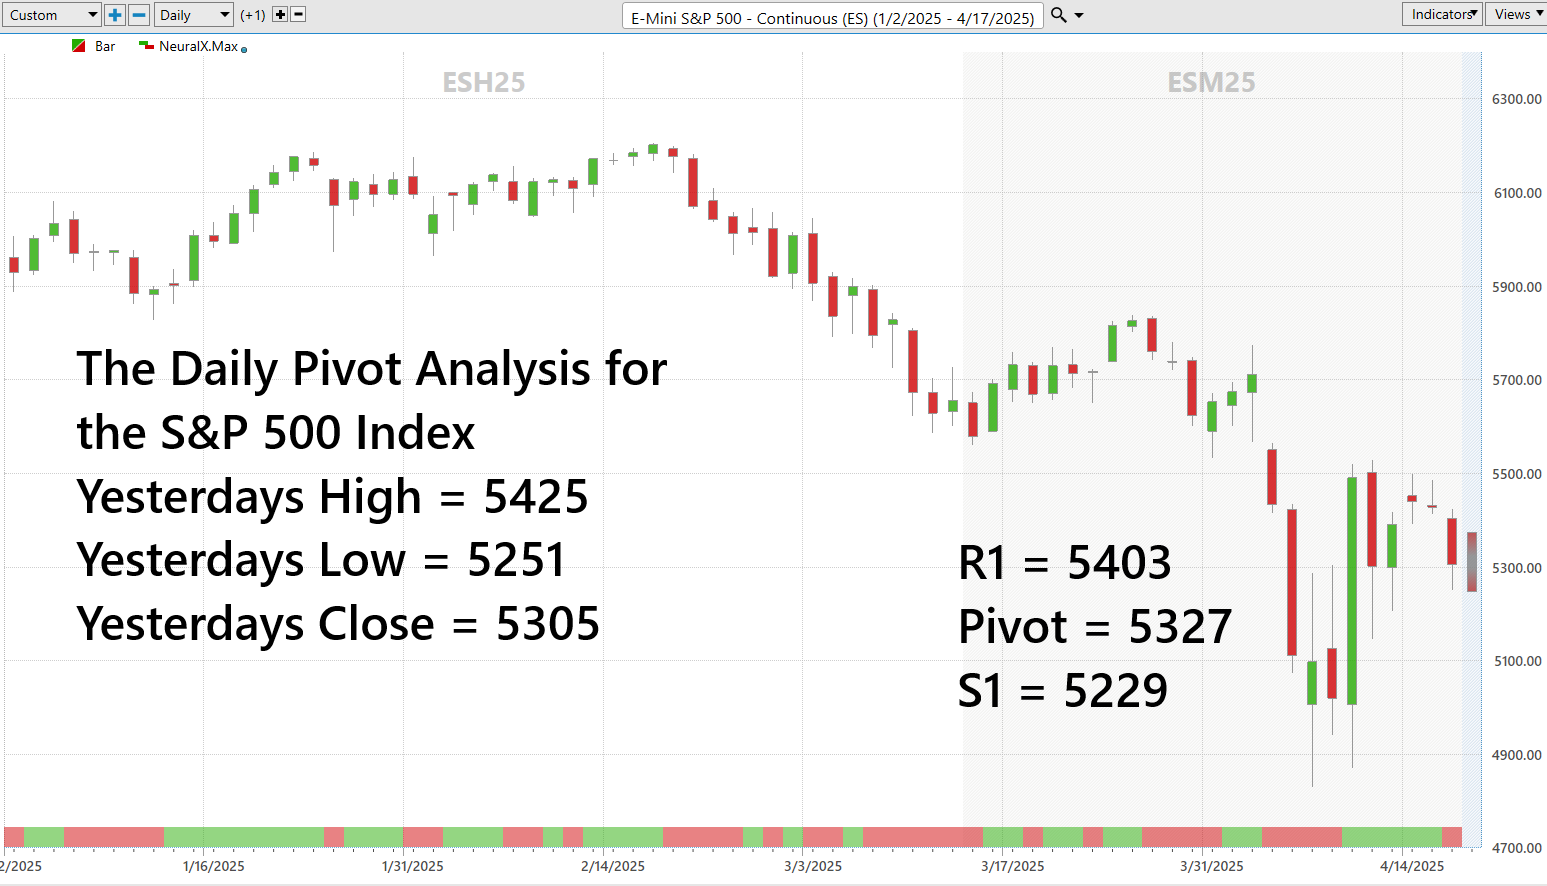
Moving to the daily analysis we can see the daily pivot is 5327.
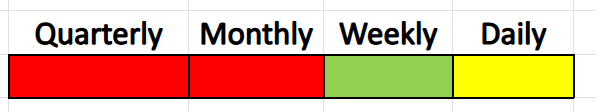
On the S&P 500, the broader quarterly trend remains negative , setting a cautious tone for long-term positioning. Zooming in, the monthly trend is also firmly negative , reinforcing the idea that sellers still maintain the upper hand on intermediate time frames. However, there’s a shift in the weekly picture: the weekly trend has turned positive , but only as long as price holds above the current weekly pivot point — a key level traders are closely monitoring. Meanwhile, on the daily chart, the trend is currently undefined, with price action trapped between support and resistance, signaling a market still searching for short-term direction.
In the form of a heat map graphic, I would draw it this way, and state that the war between the bulls and bears rages on, the bears are temporarily winning.
Think of the pivot point like a magnet with an attitude. Price gets pulled in, smacked around, and told who’s boss. You want fireworks? This is where they go off.
One of the simplest — and most profoundly effective — ways to harness the power of pivot points is to lay them directly on your charts across daily, weekly, monthly, and quarterly timeframes. With just this one action, the fog of market uncertainty begins to lift. Suddenly, you’re no longer guessing where the trend is or where it might shift. You’re seeing clear, time-tested boundaries that reveal when price is aligned with strength… and when it’s warning of reversal.
What I love about pivot points is the simplicity and clarity they offer to traders. You always know where the pivot point is on each time frame and what needs to occur for the trend to change.
You want real juice from pivot points? Stack your timeframes. When the daily, weekly, monthly, and quarterly charts are all singing the same tune, that’s your green light to go full throttle. That’s when trades explode, and you could get the biggest bang for your buck.
If you’re serious about trading, and I mean dead serious — then pivot points should already be carved into your charts. These aren’t just fancy lines that look good in theory. Pivot points are battle-tested levels that give traders the roadmap they need to survive and thrive in the fast-paced world of intraday action.
What makes them so powerful? Simple. They take the previous day’s high, low, and close — just the raw price truth — and spit out key levels that show you exactly where the fights are going to happen. Support. Resistance. That central pivot that acts like a magnet with teeth. These are price battlefields, and they let you see where the next ambush or breakout is coming from.
Now, here’s where smart traders separate themselves from the herd. They don’t just glance at pivot points and wing it. Most great traders cross-reference their pivot analysis with other trusted indicators — MACD, Stochastics, RSI, and A.I.-powered predictive tools from VantagePoint . Why? Because when those tools align with pivot levels, that’s not just a signal… that’s a green light with sirens blaring. It adds precision. It adds confidence. And most importantly, it filters out the noise so you can focus on high-probability trades with sniper-like focus.
And don’t forget — pivot points thrive on short timeframes. These levels reset daily, weekly, monthly and quarterly so they’re laser-focused on here and now. You’re reacting to real levels that matter, right now.
Here’s the kicker — it’s not rocket science. Every half-decent trading platform spits out these levels for you. You don’t have to do any math. Your job? Spot the bounces. Trade the breakouts. Cross-check your signals. And pull the trigger on opportunities you identify like a pro with a plan.
Bottom line — in this game, the clock’s always ticking. Start trying pivot points if you’re not already. Stack your signals. And trade like someone who’s here to win.
If you really want to sharpen your edge as a trader, here’s the challenge: take whatever markets you love — the Magnificent 7, your favorite Sector ETFs, Crypto pairs, or Forex majors — and apply multi-time frame pivot point analysis. Not just daily. Go deeper. Run the numbers quarterly, monthly, weekly, and daily. Stack the levels. Compare the trends. What you’ll uncover isn’t just noise, it’s the narrative. You’ll see exactly where prices have been respecting key levels, where momentum is building, and most importantly, what needs to happen for the current trend to break or accelerate. It’s like having X-ray vision for the market, and once you see it, you can’t unsee it.
Let me leave you with this: in every great trader’s life, there comes a moment — one clear, undeniable turning point — when they stop guessing and start knowing . That moment happens when they discover a better way. A way to cut through the noise. A way to finally see what’s coming before it happens. For thousands of traders, that moment began with a single decision: to harness the predictive power of artificial intelligence.
You see, A.I. doesn’t get tired. It doesn’t get emotional. It doesn’t flinch when the market throws a tantrum. It simply scans hundreds of indicators, cross-references global markets, and reveals trends most traders can’t see — until it’s too late. That’s the edge you’ve been looking for. Not a new indicator or a flash-in-the-pan strategy, but a complete shift in how you trade… and how you win.
Now here’s the good news: you don’t need to imagine how it works. You can see it in action today. We’re inviting you to a FREE online masterclass that pulls back the curtain and shows you exactly how professional traders are using A.I. to make smarter, faster, more confident trading decisions. This is not theory. This is real technology delivering real results — live, in front of your eyes.
If you’re tired of second-guessing. If you’re ready to trade with clarity instead of chaos. If you want to learn how to finally get in front of the market instead of constantly chasing it — then do yourself a favor. Click this link . Reserve your spot.
You don’t need to be a genius to know this one truth: machines are beating humans everywhere . In chess, in poker, in Go, even in Jeopardy for crying out loud. These aren’t dumb computers just following code… they’re cold, calculating killers when it comes to strategy. So, let me ask you something — if artificial intelligence can outsmart world champions in games of complexity and timing, what do you think it can do in the markets , where most traders are flying blind and chasing candles like headless chickens?
Trading is no different from chess or poker. It’s a war of probabilities, timing, and pattern recognition. And A.I.? It’s built for that. The smartest traders I know aren’t relying on luck or gut feelings. They’re stacking the odds with machine intelligence — tech that sifts through mountains of data and spits out actionable trades with razor-sharp timing. Trends that human eyes miss? The A.I. sees them coming. Reversals that trap the amateurs? The A.I. warns you in advance.
Now, I’m not asking you to take my word for it. I’m inviting you to see it for yourself . Experience our A.I. trading software in action — real markets, real data, real time. This isn’t smoke and mirrors. It’s a glimpse into the future of trading. You’ll walk away from this session with clarity, confidence, and a strategy you can apply immediately.
So here’s your moment. You can keep trading like it’s 1995 — or you can step into the modern world and let machine learning help you make smarter, faster, more profitable decisions. Sign up now and come see what the fuss is all about. The future of trading is already here… the only question is, are you smart enough to use it?
It’s not magic.
It’s machine learning.
THERE IS A SUBSTANTIAL RISK OF LOSS ASSOCIATED WITH TRADING. ONLY RISK CAPITAL SHOULD BE USED TO TRADE. TRADING STOCKS, FUTURES, OPTIONS, FOREX, AND ETFs IS NOT SUITABLE FOR EVERYONE.IMPORTANT NOTICE!
DISCLAIMER: STOCKS, FUTURES, OPTIONS, ETFs AND CURRENCY TRADING ALL HAVE LARGE POTENTIAL REWARDS, BUT THEY ALSO HAVE LARGE POTENTIAL RISK. YOU MUST BE AWARE OF THE RISKS AND BE WILLING TO ACCEPT THEM IN ORDER TO INVEST IN THESE MARKETS. DON’T TRADE WITH MONEY YOU CAN’T AFFORD TO LOSE. THIS ARTICLE AND WEBSITE IS NEITHER A SOLICITATION NOR AN OFFER TO BUY/SELL FUTURES, OPTIONS, STOCKS, OR CURRENCIES. NO REPRESENTATION IS BEING MADE THAT ANY ACCOUNT WILL OR IS LIKELY TO ACHIEVE PROFITS OR LOSSES SIMILAR TO THOSE DISCUSSED ON THIS ARTICLE OR WEBSITE. THE PAST PERFORMANCE OF ANY TRADING SYSTEM OR METHODOLOGY IS NOT NECESSARILY INDICATIVE OF FUTURE RESULTS. CFTC RULE 4.41 – HYPOTHETICAL OR SIMULATED PERFORMANCE RESULTS HAVE CERTAIN LIMITATIONS. UNLIKE AN ACTUAL PERFORMANCE RECORD, SIMULATED RESULTS DO NOT REPRESENT ACTUAL TRADING. ALSO, SINCE THE TRADES HAVE NOT BEEN EXECUTED, THE RESULTS MAY HAVE UNDER-OR-OVER COMPENSATED FOR THE IMPACT, IF ANY, OF CERTAIN MARKET FACTORS, SUCH AS LACK OF LIQUIDITY. SIMULATED TRADING PROGRAMS IN GENERAL ARE ALSO SUBJECT TO THE FACT THAT THEY ARE DESIGNED WITH THE BENEFIT OF HINDSIGHT. NO REPRESENTATION IS BEING MADE THAT ANY ACCOUNT WILL OR IS LIKELY TO ACHIEVE PROFIT OR LOSSES SIMILAR TO THOSE SHOWN.