
This week’s ai stock spotlight is Curtiss-Wright ($CW))
Curtiss-Wright Corporation ( NYSE: CW ) is a classic American industrial powerhouse, deeply rooted in the story of aviation’s most legendary figures. Born in 1929 through the merger of two pioneering aviation giants — the Wright Aeronautical Company, founded by the iconic Wright Brothers, and the Curtiss Aeroplane and Motor Company, launched by the trailblazing Glenn Curtiss — this firm embodies America’s rich tradition of aerospace excellence and technical ingenuity.
While they no longer build the airplanes themselves, make no mistake: Curtiss-Wright is an essential player behind the scenes, crafting highly engineered components that aircraft, submarines, and nuclear plants rely upon. Their bread-and-butter products include flight control actuators, precision valves, sensors, embedded computing, and naval propulsion systems; vital technologies underpinning America’s national defense and global aerospace industries.
Headquartered in Davidson, North Carolina, Curtiss-Wright employs roughly 8,200 dedicated workers worldwide, punching far above its weight class. They’re not flashy, but their consistent performance and unwavering reliability have earned the trust of governments and blue-chip clients around the globe.
Let me tell you something most investors don’t realize: Curtiss-Wright has quietly shaped our modern world more than many recognize. First, decades ago, they pioneered operational flight simulators — training generations of pilots long before simulators became industry-standard equipment. Second, in the 1960s, their groundbreaking X-19 tiltrotor aircraft set the stage for today’s vertical-lift innovations like the V-22 Osprey.
Curtiss-Wright’s current financial position is as robust as their storied history suggests. They boast double-digit revenue growth, solid operating margins, and a record-breaking backlog, all of which speak loudly to investors looking for stability. The firm has impressively raised its dividend annually for more than 50 consecutive years, underscoring disciplined financial stewardship that places shareholders squarely in focus.
Curtiss-Wright ( NYSE: CW ) operates in a fiercely competitive landscape, facing off primarily against three heavyweight rivals. TransDigm Group is an aggressive aerospace components specialist known for lucrative niche products and aggressive acquisition strategies. Spirit AeroSystems dominates in large-scale aerostructures, primarily serving major aviation giants Boeing and Airbus. Meanwhile, Teledyne Technologies brings diversified technical expertise across aerospace, defense electronics, and advanced sensor systems. For investors, understanding these competitors’ strategic strength and market positions is vital — as each represents significant challenges and opportunities shaping Curtiss-Wright’s competitive future.
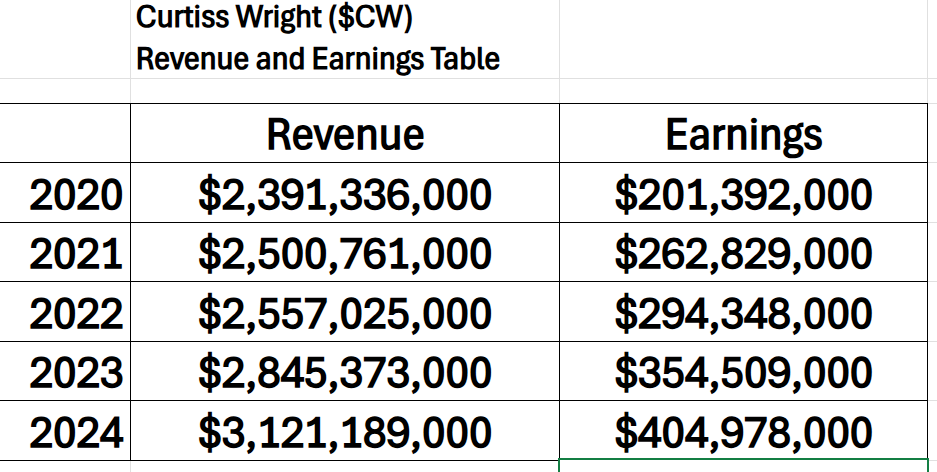
When we study revenue and earnings over the last 5 years, we can see that earnings have grown 101% since 2020, while revenue has only grown 31%. This shows improved efficiency.
Of course, there are always risks worth considering. Curtiss-Wright’s fortunes rise and fall with defense budgets, aerospace industry cycles, and international trade dynamics. Geopolitical tensions, trade disputes, and tariffs create headwinds — but management has consistently navigated these storms with poise, preserving profitability and margins.
Listening to recent earnings calls, you hear clear-eyed confidence and disciplined execution. Revenues have jumped by about 13% year-over-year, and operating income surged nearly 29%, bolstered by record bookings. Curtiss-Wright’s executives acknowledge challenges like tariffs candidly but swiftly reassure investors they’re well-prepared… ”We’ve got ’em covered,” as they’ve plainly said.
What makes Curtiss-Wright appealing today isn’t flashy hype; rather, it’s the quiet resilience and disciplined performance that defines America’s industrial backbone. This is a company that has weathered wars, economic upheaval, and technological disruption — and consistently emerges stronger.
Bottom line: Curtiss-Wright remains one of those hidden industrial gems. For traders and investors looking for reliability, historical pedigree, consistent cash flow, and rock-solid dividend growth, Curtiss-Wright is a name that deserves careful consideration. Ignore them at your peril, because this firm, quietly yet decisively, continues to deliver real value to shareholders and remains essential to American industry and national security.
In this stock study, we’ll analyze the key indicators and metrics that guide our decisions on whether to buy, sell, or stand aside on a particular stock. These inputs serve as both our framework and behavioral compass, rooted in data and powered by predictive intelligence.
- Wall Street Analysts Ratings and Forecasts
- 52-Week High and Low Boundaries
- Best-Case / Worst-Case Scenario Analysis
- VantagePoint A.I. Predictive Blue Line
- Neural Network Forecast (Machine Learning)
- VantagePoint A.I. Daily Range Forecast
- Intermarket Analysis
- Our Suggestion
While our decisions are ultimately anchored in artificial intelligence forecasts, we briefly review the company’s fundamentals to better understand the financial environment it operates in. For $CW, this context helps us assess the quality of the A.I. signal within a broader economic and industry backdrop.
Wall Street Analysts Forecasts
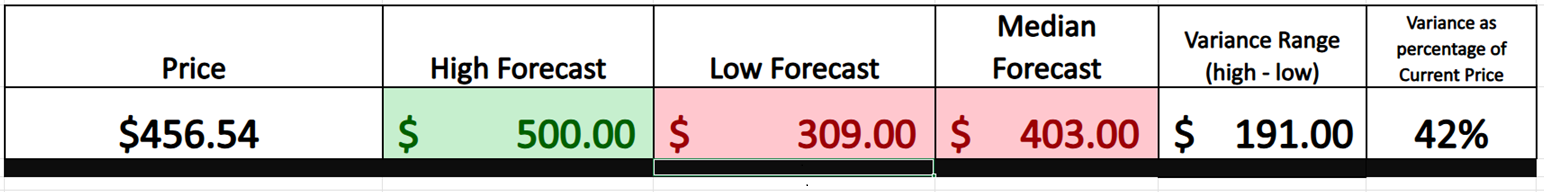
Here’s the breakdown on Curtiss-Wright (NYSE: CW) . Seven sharp-eyed Wall Street analysts have weighed in with 12-month price predictions, and the consensus lands at around $403 — though the most optimistic bull sees a climb all the way to $500, while the most cautious bear pegs it tumbling back to $309.
Now, here’s the juicy part: the difference between these two extremes is a whopping 42%. That gap tells you straight-up that analysts see significant uncertainty ahead. Translation? Brace yourself — Curtiss-Wright is poised to swing wildly, with plenty of twists and turns baked into the cake over the next year. This isn’t a sleepy stock. It’s a volatile beast that’ll keep traders on their toes.
52 Week High and Low Boundaries
Listen up — because this is crucial. Every stock you’ll ever trade lives in a cage marked by its 52-week high and its 52-week low. These aren’t just random numbers; they’re your map to past chaos and past triumph. Want instant clarity on a stock’s temperament? Skip the gurus, skip the noise, and go straight to this boundary. It’s your ultimate yardstick — showing you exactly how wildly a stock has bounced around, the emotional battles already fought, and the storms it’s weathered.
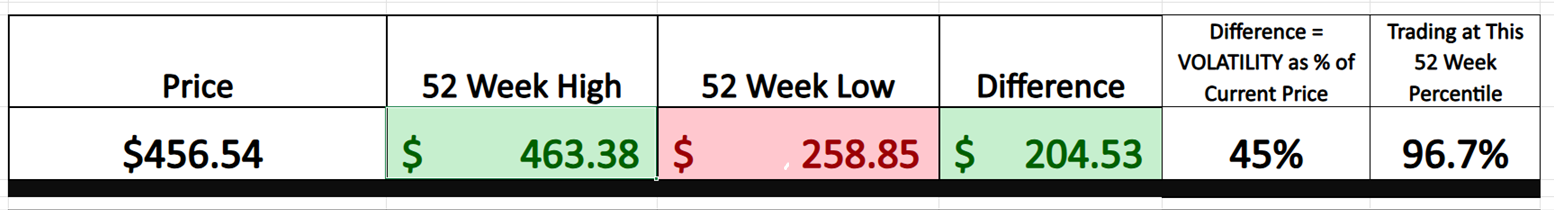
Over the past year, Curtiss-Wright (CW) sank as low as $258.85 and then rocketed up to $463.38 — a massive swing that screams “volatility” loud and clear. That’s a $200 rollercoaster, folks — pure adrenaline for traders who love action. This tells you immediately how aggressive or tame the ride ahead might be. Ignore it at your peril.
Here is the 52- week chart for $CW which clearly tells the story of the last year.
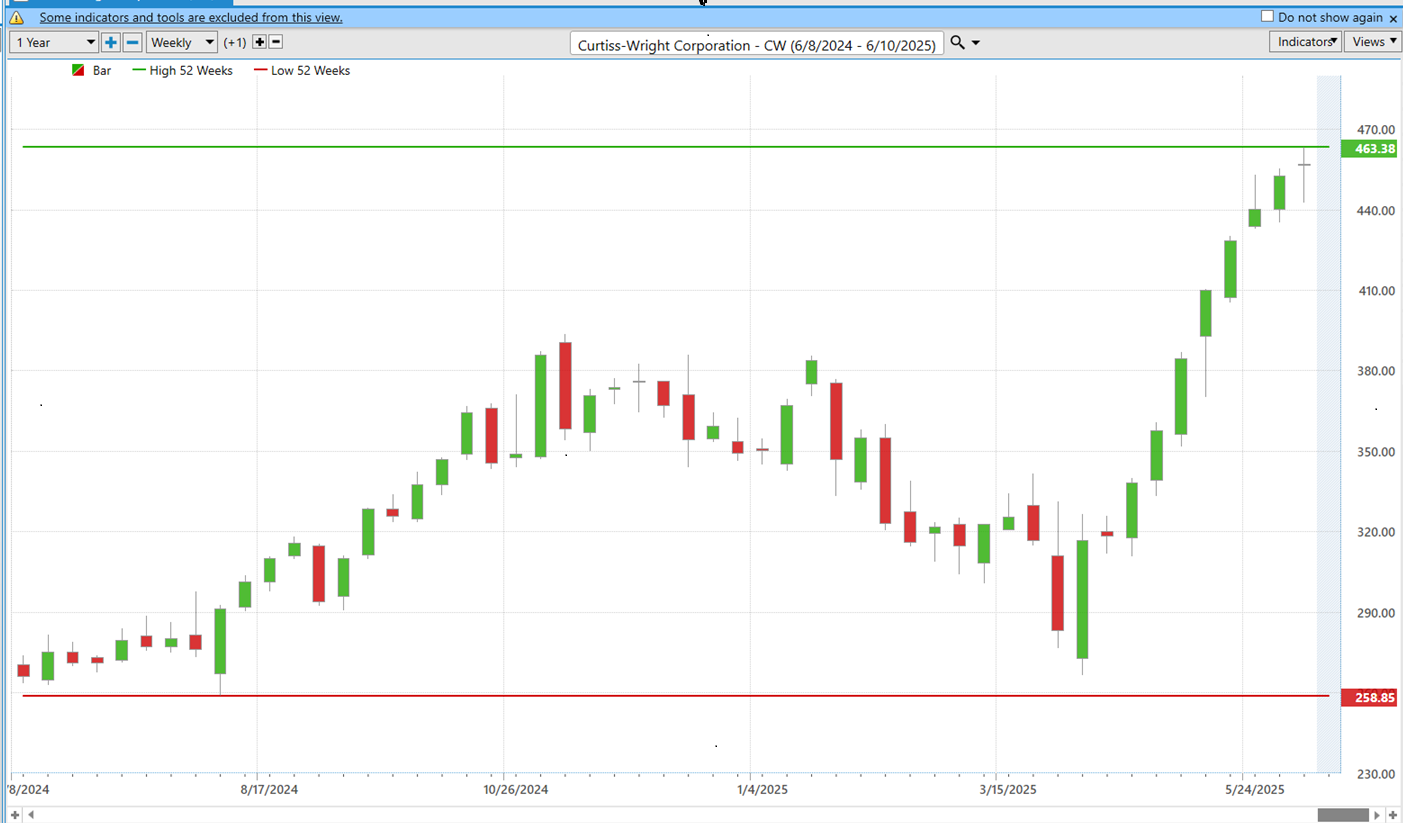
This is the stage upon which every market drama unfolds: every investor panic, euphoric rally, and emotional sell-off.
For traders, these boundaries aren’t mere statistics, they’re crucial indicators. Forget pundits, market gurus, or Twitter chatter. The real insight is in the chart. The gap between a stock’s highest high and lowest low reveals its volatility profile — how sharply, swiftly, and often it has moved over the past year. This metric isn’t just useful; it’s essential, a clear-eyed glimpse into the stock’s true personality.
The 10-year chart of Curtiss-Wright (NYSE: CW) paints a powerful picture of resilience and transformation.
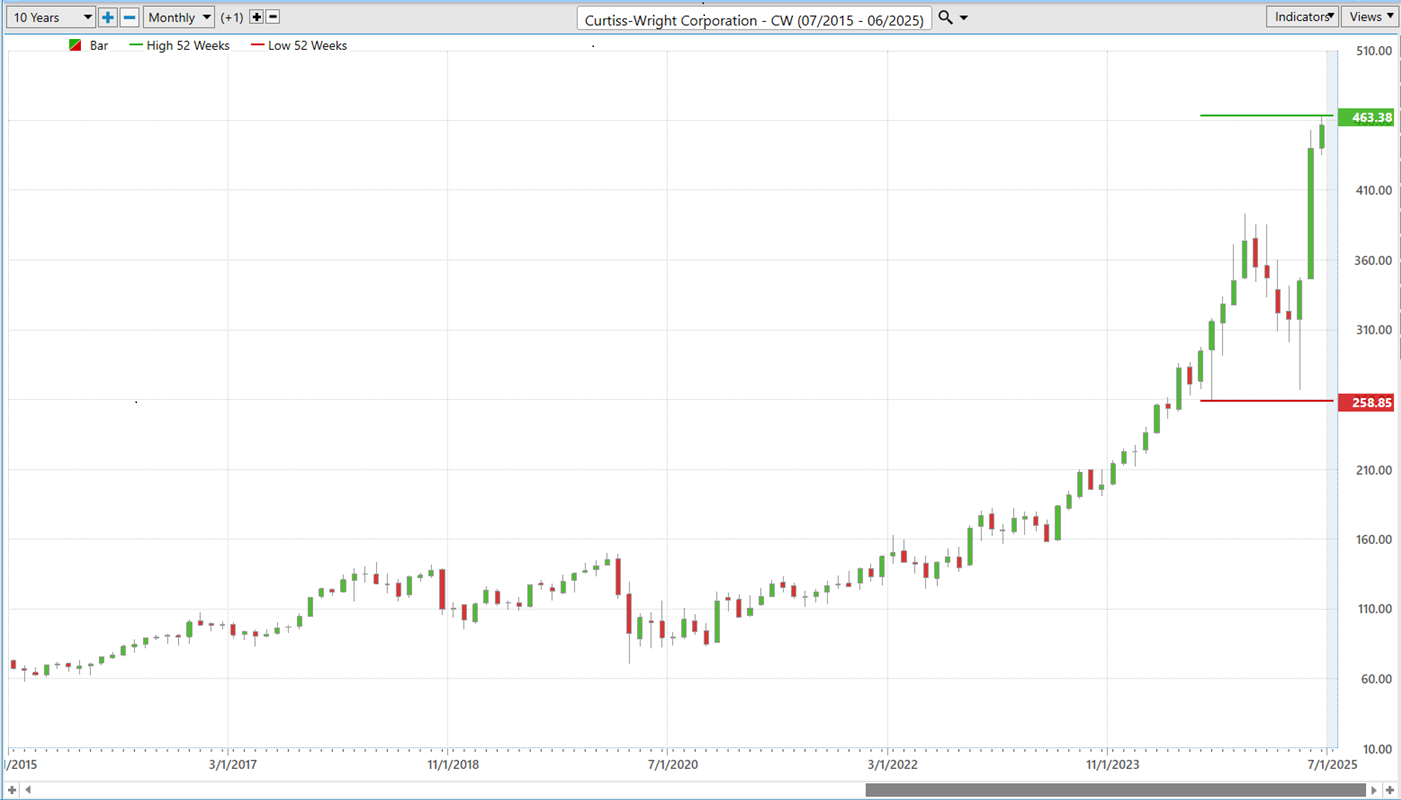
Now, listen closely: this breakout isn’t just a technical move — it’s strategically synchronized with America’s shifting defense priorities. We’re witnessing Curtiss-Wright breaking boldly into uncharted territory, pushing to fresh all-time highs. In the markets, price action speaks first — and this move is speaking volumes. It’s attracting capital, and rightly so.
What makes $CW a red-hot opportunity isn’t just the chart — it’s the fact that it’s busting through both 52-week and 10-year highs at the same time. That’s not luck, that’s raw, undeniable momentum.
Make no mistake: This isn’t some speculative meme-driven mania. What we’re watching here is the savvy institutional money stepping up and fundamentally reassessing this stock, rewarding Curtiss-Wright for its pivotal role in a critical American asset class — defense and aerospace.
Best-Case/Worst-Case Analysis
Here’s a truth every sharp trader eventually learns: the market isn’t a gentleman. It’s a beast. And the part most traders are too scared to stare down? Volatility. But if you want to survive, you’d better not just stare at it… study it like your future depends on it. Because it does.
Before you throw a single dollar into this ticker, there’s one brutally honest question that demands an answer: How much is this stock going to swing? Is it a slow-burning freight train? Or is it going to whip around like a firehose in a windstorm?
Now, forget the equations, the Greeks, and the mystical mumbo-jumbo Wall Street loves to dress up in thousand-dollar suits. The real insight isn’t in a formula — it’s in the last 52 weeks . You don’t need a PhD in finance to see the story. Just track the biggest surges and the deepest dives. When CW dropped to $258.85 and then launched to $463.38 in a single year, that wasn’t random. That was a pattern. That was the stock showing you its character — volatile, powerful, and driven by fundamentals.
Because here’s a law of the market as reliable as gravity: History doesn’t repeat, but it sure does rhyme. Those past moves? They’re the rhythm of the beast. And if the underlying story — rising defense spending, mission-critical contracts, nuclear infrastructure — is still intact, odds are, that rhythm hasn’t changed.
This little “back-of-the-envelope” exercise isn’t just a trick. It’s your secret weapon. It forces you to trade reality, not fantasy. Hope is a terrible trading strategy. But understanding the size of the swings? That’s risk management at its finest.
And in a world where most traders get blindsided by the very thing they should’ve seen coming — a 30% plunge or a 50% rocket — this kind of clarity is golden. If you’re serious about trading CW , don’t just glance at a chart. Dissect the swings. Know the tempo. Because the market doesn’t hide its secrets. It telegraphs them. You just have to be smart enough — and humble enough — to listen.
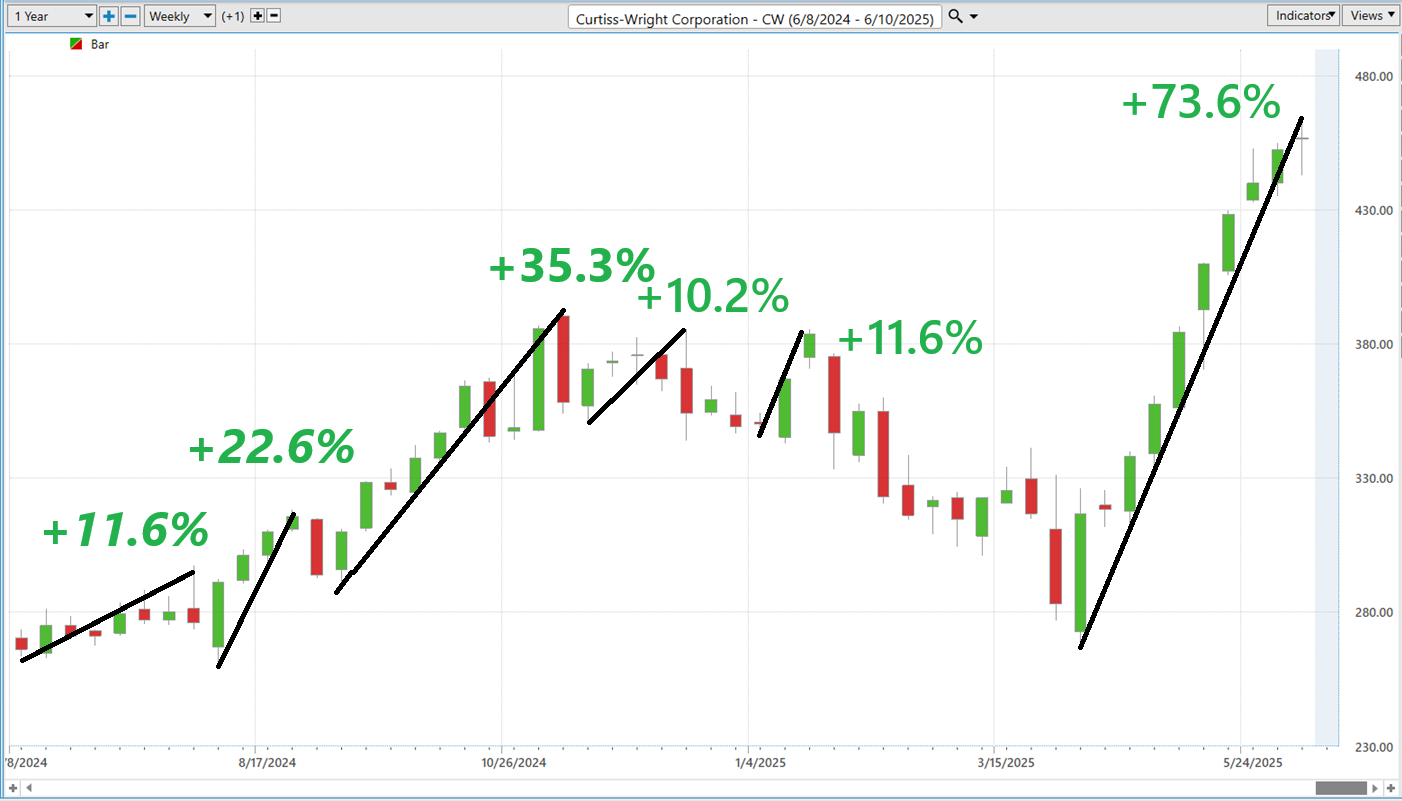
First, we look at the best-case scenario by measuring the largest uninterrupted rallies over the past 12 months.
Followed by the worst-case scenario, where we measure the largest uninterrupted declines.
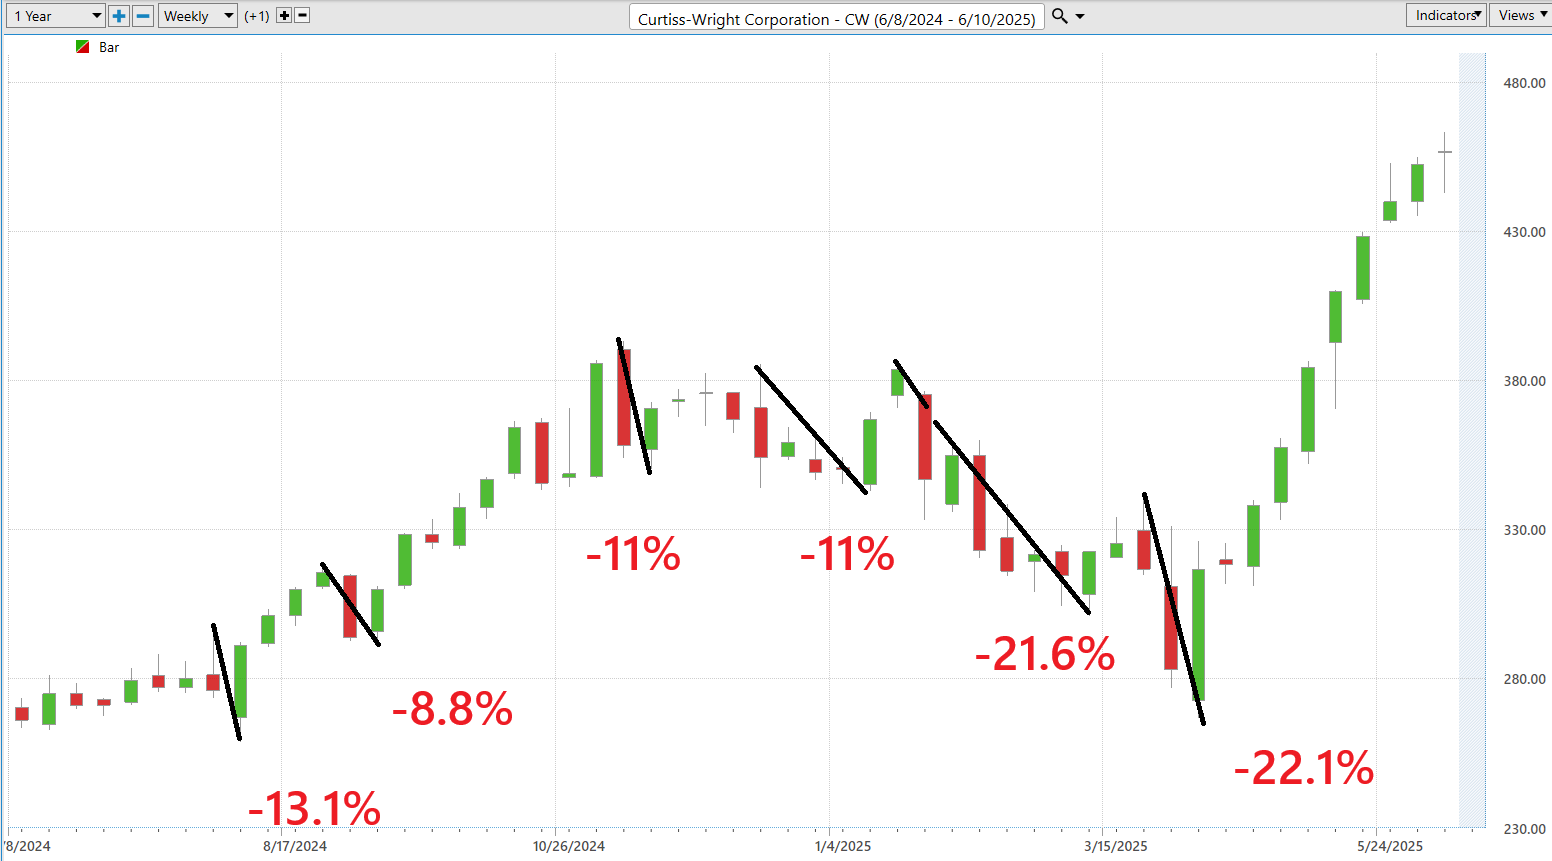
Here’s the straight truth: if you can read just these two charts, you’ll have a solid grip on the risk and reward potential of trading $CW .
No guesswork. No guru nonsense. Just cold, hard insight that tells you exactly how this beast moves.
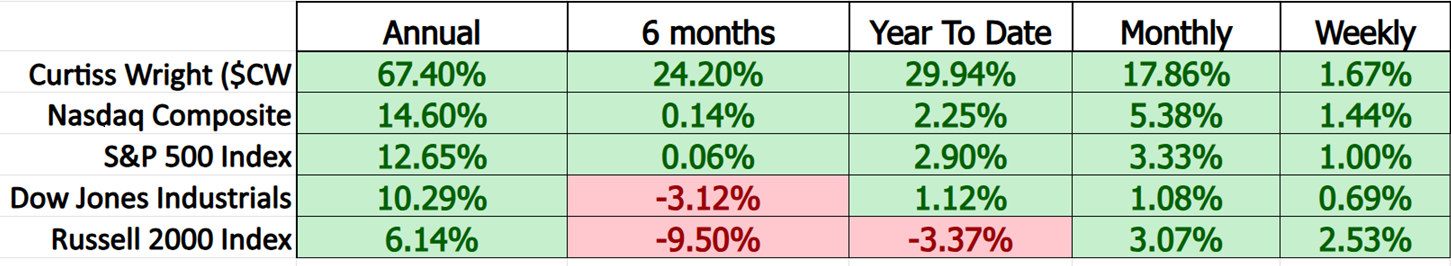
Compare $CW to the broader market across any meaningful time frame — 90 days, six months, or a full year — and a consistent narrative begins to emerge. Curtiss-Wright is outperforming , and not by accident. While much of the equity landscape has been marked by hesitation, sector rotation, and defensive positioning, Curtiss-Wright has demonstrated steady, disciplined strength.
In a market shaped by geopolitical tension, economic ambiguity, and shifting policy backdrops, conviction is the new currency — and Curtiss-Wright is quietly building momentum rooted in fundamental clarity. This is a trend gaining traction, and in today’s market, that kind of acceleration is rare.
Curtiss‑Wright ($CW) carries a 5‑year beta of approximately 1.14, making it more volatile than the broader market (where beta = 1).
In plain terms for the average trader: a beta above 1 (like CW’s 1.14) means that if the market moves up 1%, CW is likely to go up about 1.14%, and conversely, it’ll fall a bit more than the market in a downturn. It’s like riding a booster — bigger moves on both the upside and the downside.
So, what does this mean for you? If you’re a steady investor covering your sleep at night, CW might feel like a bit of a rollercoaster. But for active traders, that extra zig and zag translates into bigger profit potential.
In short, CW’s beta says it doesn’t follow the market, it dances with it — with a sharper step.
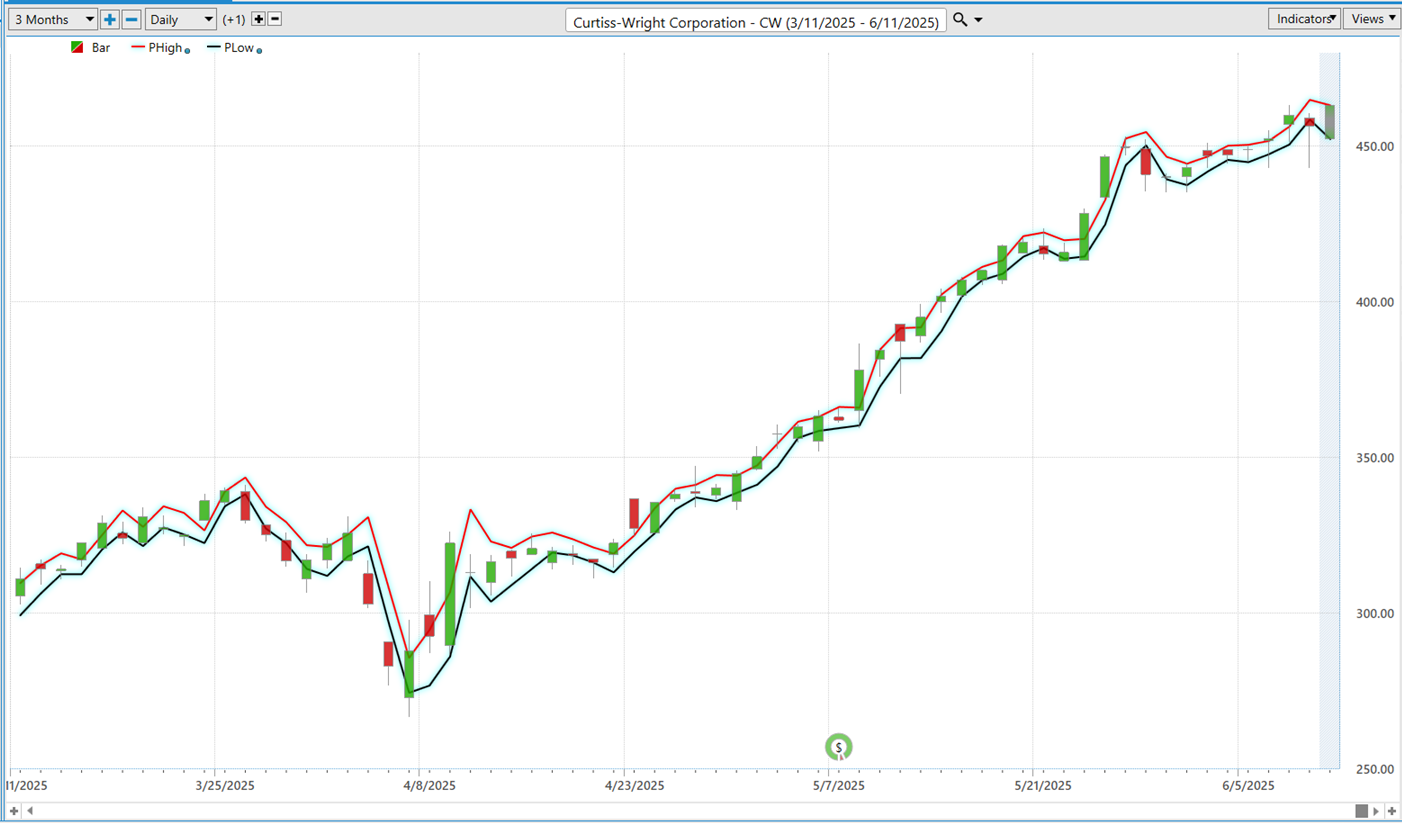
Vantagepoint A.I. Predictive Blue Line
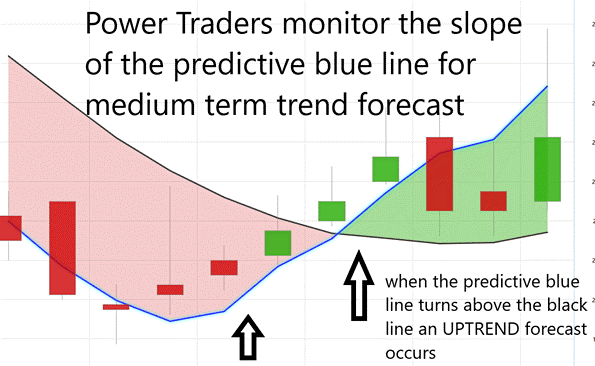
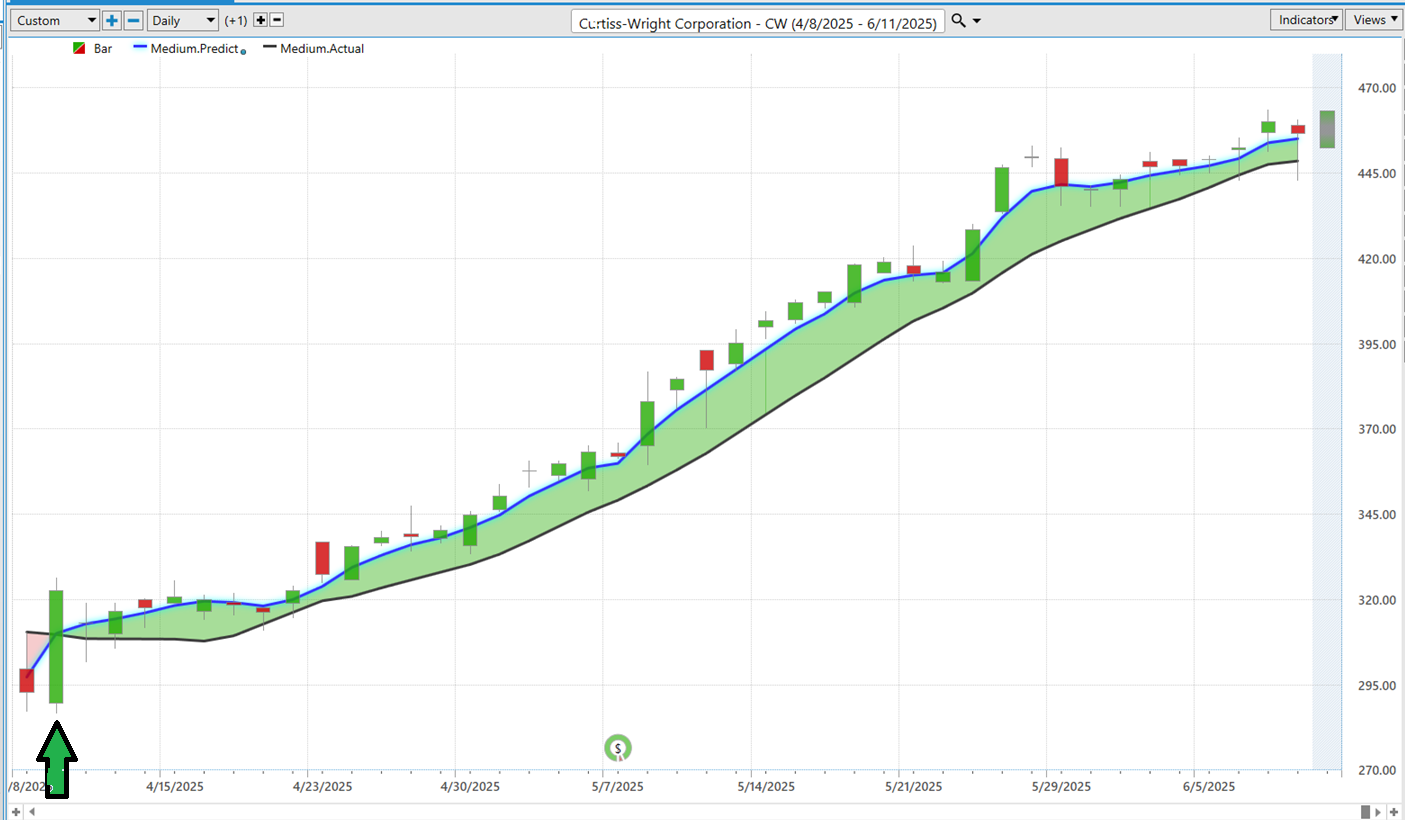
If you’re thinking about trading $CW , let me break it down for you—because real success comes from using real tools backed by real intelligence. And that’s exactly what you get with VantagePoint’s Predictive Blue Line . This is artificial intelligence with direction — forward-looking, momentum-measuring, and razor-sharp. It slices through all the Wall Street noise and gives you a heads-up on where the market may be heading before the crowd catches on.
When that Predictive Blue Line starts pointing north, that’s not just a green light, it’s a possible sign that Curtiss-Wright is building strength , and that institutional money might be walking through the front door.
But when that line starts tilting down? That’s not a time to get comfortable. That’s your early warning system lighting up — telling you to tighten up those stop-losses, trim a little profit, or recheck your thesis before the market makes the decision for you.
And now let’s talk about something I love: the Value Zone . That sweet spot where $CW drifts down and taps or dips just below the Predictive Blue Line while still in an uptrend . To the average trader, it might look like weakness. But to the pros? That’s opportunity in disguise . That’s often where the smart money steps in quietly, efficiently, and ahead of the crowd.
On the flip side, if $CW’s been drifting lower and suddenly jumps above the Blue Line? Be careful. That’s where false rallies like to live. Looks like strength on the surface — but underneath, it’s often just stalling momentum in a flashy suit. You chase it, and it’ll leave you holding the bag.
Bottom line? The Predictive Blue Line isn’t just a chart gimmick — it’s your edge. Use it wisely, and you’ll trade with confidence instead of confusion.
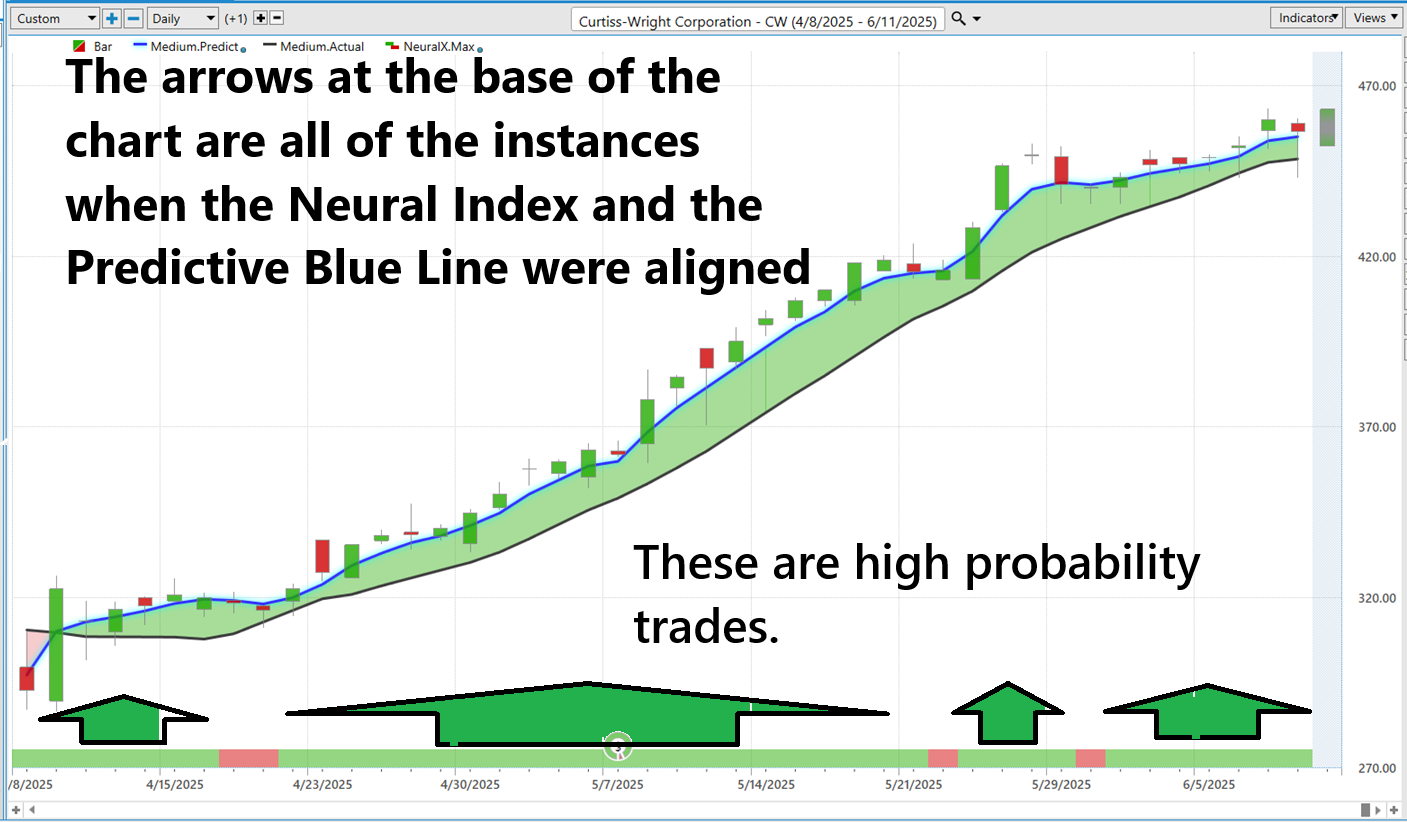
Neural Network Forecast (Machine Learning)
Neural networks are like having a bloodhound for patterns — sniffing out trends, reversals, and price setups long before your gut or some lagging indicator ever catches on. They don’t guess — they learn from massive amounts of market data and adapt in real time, which means you’re not just trading history, you’re anticipating the future. For traders who are serious about getting an edge, this isn’t sci-fi — it’s your secret weapon hiding in plain sight.
Let’s be real — most traders out there aren’t trading. They’re guessing. Chasing headlines. Glued to the latest “breaking alert” from financial TV and calling that a strategy. But let me tell you something straight — in this market, guessing will gut your account . Gut feelings aren’t a plan. Hype isn’t a system. That kind of thinking is how you turn your hard-earned savings into a donation to Wall Street’s bonus pool.
The market doesn’t care about your emotions . It doesn’t care what some talking head “feels” might happen. It respects one thing: data . Discipline. Decisions based on facts. And that’s exactly where VantagePoint’s neural networks flip the script. This is artificial intelligence that’s been trained on years of market data. It doesn’t flinch during earnings season or spiral over political headlines. It scans thousands of intermarket relationships, crunches them in seconds, and gives you a clear, mathematically grounded forecast.
That Neural Index ? That’s your playbook. When it turns green — momentum’s building, and you’ve got the green light to press your edge. When it flips red — you know it’s time to pull back, take profits, or sit tight. No guesswork. No drama. Just clarity and control.
VantagePoint A.I. Daily Range Forecast
What used to sound like science fiction — predicting market moves with near-surgical accuracy is now standard practice for smart, disciplined traders. The tools have evolved, the rules have shifted, and if you’re still out here reacting instead of anticipating, I’ve got news for you: you’re already behind.
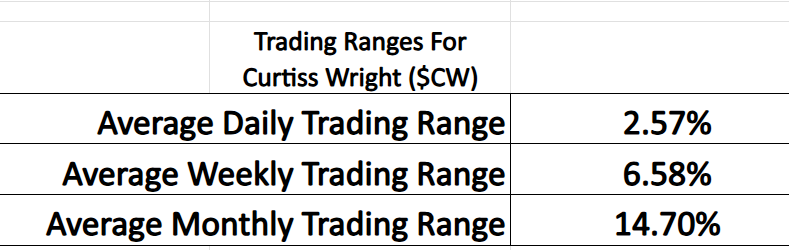
Zoom out and really look at $CW ’s behavior across daily, weekly, and monthly time frames over the past year. This is a clear, calculated trend. You’re seeing steady, quiet accumulation — likely by institutions who know exactly what they’re doing. This isn’t some Reddit-fueled rally.
Here’s the truth: volatility isn’t the enemy. It’s the environment. The real task for traders isn’t dodging it, but learning how to navigate it. You’ve got to build a system that adapts, one that turns those sharp price swings into high-probability setups . And $CW is a perfect case study — it rewards traders who come prepared with a plan, not those rolling the dice and hoping for luck.
So take a close look at the average daily, weekly, and monthly trading ranges for $CW over the past year. Knowledge isn’t just power… it’s potential profit.
This is where VantagePoint A.I. stops being a tool and starts being your secret weapon — a real force multiplier in a market that’s moving faster than most traders can think. While the herd’s out there chasing headlines and reacting to yesterday’s news, this tech is slicing through the noise, spotting patterns, and lining up opportunities before they show up on your broker’s radar.
VantagePoint isn’t here to help you catch up. It’s here to put you ahead of the curve — where real money could be made. This isn’t guesswork. It’s predictive intelligence for traders who are sick of flying blind and ready to start playing like a pro.
Check out the following Daily Range Forecast chart and you will understand the power that artificial intelligence brings to the table.
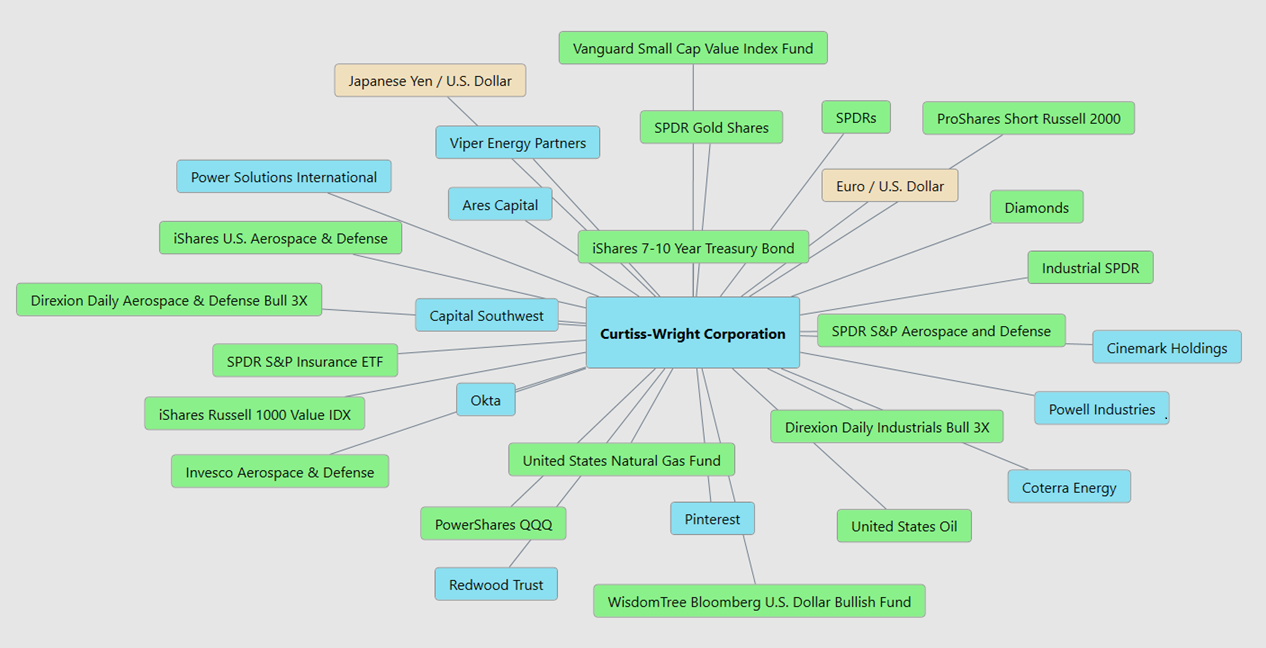
Intermarket Analysis
Intermarket analysis is the study of how different markets — like stocks, bonds, commodities, and currencies — interact with each other. It helps traders see the big picture by spotting patterns and relationships, such as how rising interest rates (bonds) might impact stock prices or how oil prices can affect airline stocks. Instead of looking at one chart in isolation, intermarket analysis connects the dots across markets to make smarter, more informed trading decisions.
The price action of Curtiss-Wright Corporation ($CW) is primarily driven by intermarket dynamics involving its exposure to aerospace, defense, and industrial sectors, with key influences from macroeconomic trends, commodity prices, and equity market correlations. Strong demand in aerospace and defense, fueled by global military modernization and nuclear infrastructure investments, supports revenue growth, as seen in CW’s robust Q1 2025 performance with 13% sales growth and a record $1 billion in new orders, particularly in Defense Electronics and Naval & Power segments. Rising commodity prices, like steel and aluminum, impact input costs for its engineered products, while favorable U.S. dollar trends enhance export competitiveness. Positive equity market sentiment, reflected in a 62.57% yearly stock price surge and analyst “Buy” ratings, aligns with CW’s strong fundamentals, though potential naval defense timing challenges and a 1.14 beta indicate sensitivity to broader market volatility.
Here are the 31 key drivers of $CW price:
Our Suggestion
Over the past two quarters, Curtiss-Wright’s tone has shifted from strong and assured to decisively bullish . Management has delivered promises with substantial growth in sales, margins, backlog, and cash flow. Now, they’re raising the bar once again with aggressive guidance and a renewed strategic posture. For investors and traders, it’s a compelling narrative — confidence backed by crisp execution.
($CW) is strategically positioned for continued growth as global defense and infrastructure budgets firm up and expand. With its deep footprint in mission-critical technologies, from advanced naval propulsion systems to nuclear energy components and aerospace control systems, CW stands to benefit directly from rising geopolitical tensions and renewed commitments to national security and energy resilience.
As governments across Europe, Asia, and North America ramp up defense modernization and infrastructure hardening, Curtiss-Wright’s backlog strength, robust book-to-bill ratio, and expanding margin profile signal a company not just surviving but thriving amid structural tailwinds. Their proven execution, disciplined capital deployment, and growing global presence make them a go-to supplier in a world that’s rearming and rebuilding at scale.
In Q1 2025, CW reported a 13% increase in sales to $806 million , a 34% jump in adjusted operating income, and a 42% rise in adjusted EPS — while simultaneously raising its full‑year guidance for sales, margins, EPS, and free cash flow. This clearly reflects a company executing its strategic vision.
We suggest that you place $CW on your trading radar. What makes $CW such an exciting opportunity right now is its powerful breakout to both 52-week and 10-year highs — an incredibly bullish technical signal that points to strong institutional accumulation and sustained investor confidence. When a stock demonstrates this kind of long-term price leadership, it typically reflects robust fundamentals and earnings momentum, making it a prime candidate for continued outperformance.
It has outperformed and will continue to offer great trading opportunities in the months ahead.
Use the VantagePoint’s A.I. Daily Range Forecast for trading opportunities moving forward.
Practice great money management on all your trades.
It’s not magic.
It’s machine learning.
Disclaimer: THERE IS A HIGH DEGREE OF RISK INVOLVED IN TRADING. IT IS NOT PRUDENT OR ADVISABLE TO MAKE TRADING DECISIONS THAT ARE BEYOND YOUR FINANCIAL MEANS OR INVOLVE TRADING CAPITAL THAT YOU ARE NOT WILLING AND CAPABLE OF LOSING.
VANTAGEPOINT’S MARKETING CAMPAIGNS, OF ANY KIND, DO NOT CONSTITUTE TRADING ADVICE OR AN ENDORSEMENT OR RECOMMENDATION BY VANTAGEPOINT AI OR ANY ASSOCIATED AFFILIATES OF ANY TRADING METHODS, PROGRAMS, SYSTEMS OR ROUTINES. VANTAGEPOINT’S PERSONNEL ARE NOT LICENSED BROKERS OR ADVISORS AND DO NOT OFFER TRADING ADVICE.